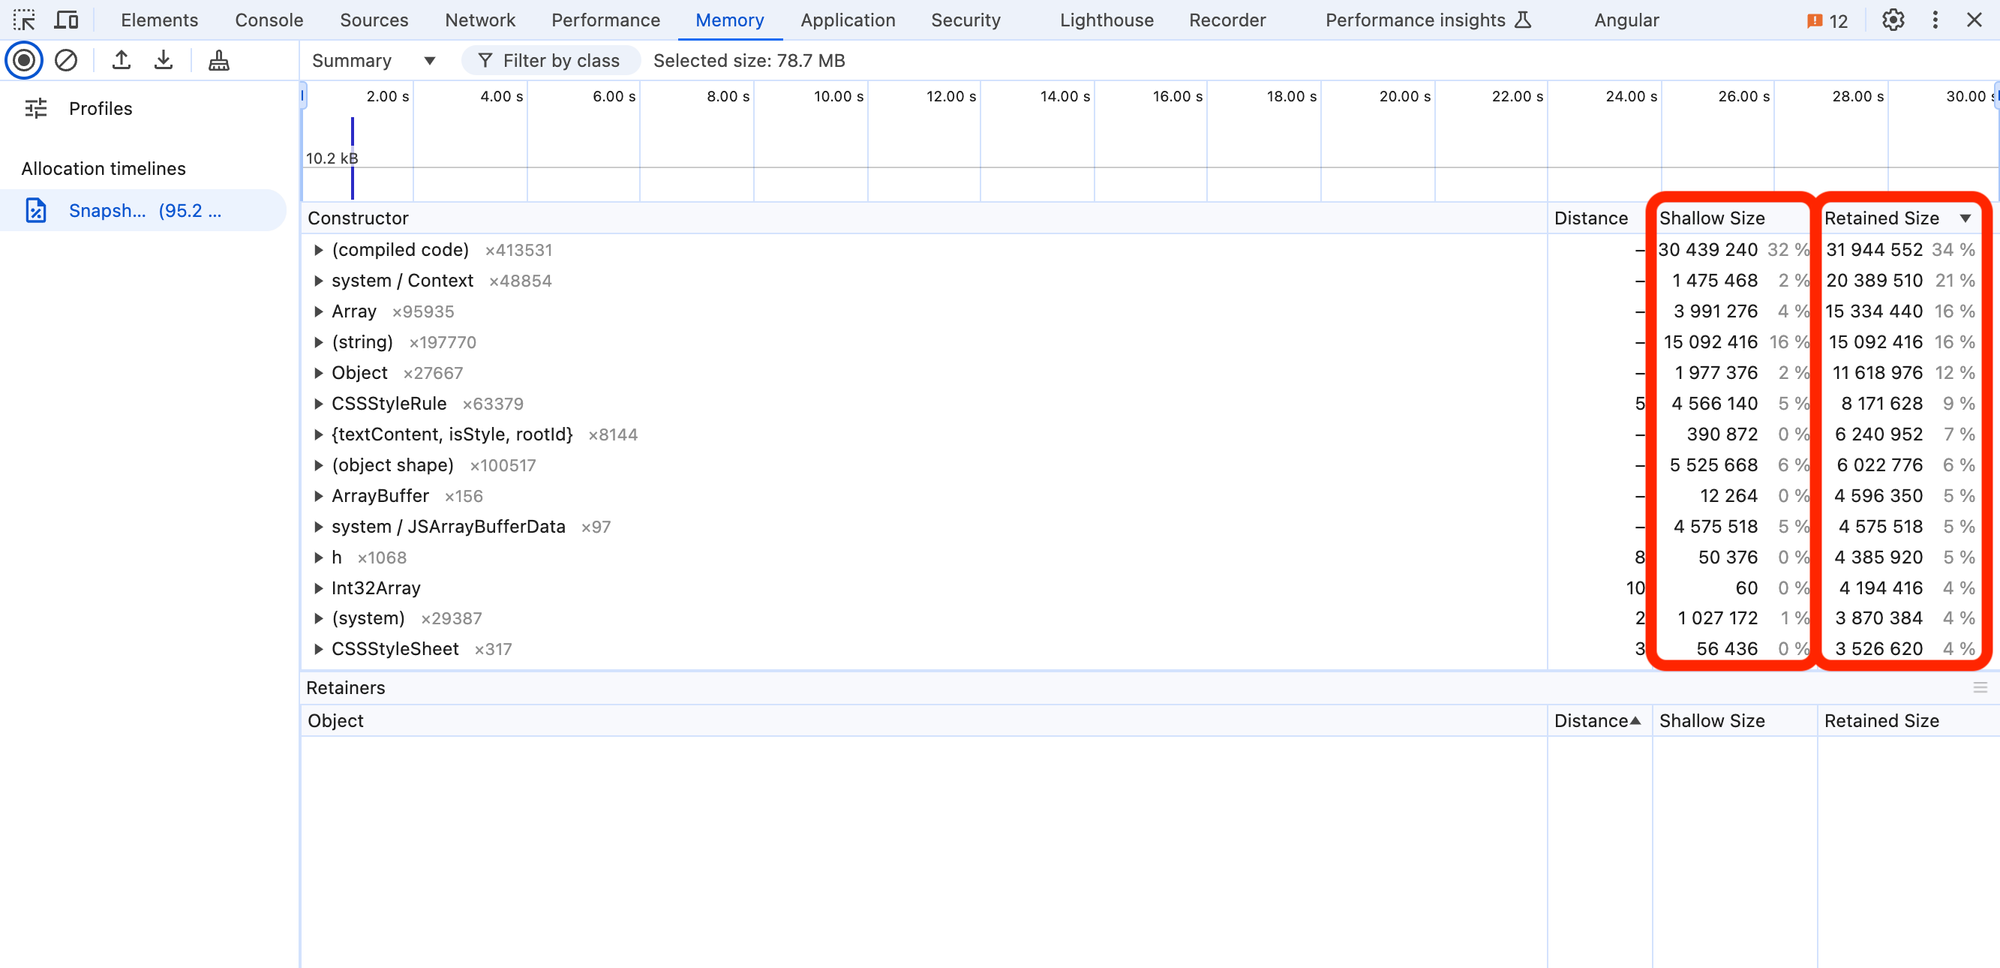
The difference between Shallow Size and Retained Size in the Chrome DevTools memory panel

When profiling memory usage with Chrome DevTools, we notice two key metrics: shallow size and retained size. These metrics pop up frequently in heap snapshots and can be crucial for understanding memory behavior:

In this article, we'll dive into what these terms mean, their differences, and how they can help us debug memory problems more effectively.
So let's get started! 🚀
Shallow Size
The shallow size of an object is the amount of memory that the object itself occupies—just the memory footprint of that object, without considering any other objects it references.
Think of shallow size as the direct memory cost of an object. It’s helpful for understanding the exact space the object takes up, but it doesn’t tell us anything about the memory usage of objects connected to it.
For example, if Object A references Object B, then:
- Shallow size of A: Only the memory A occupies, not including B.
Shallow size helps us see which individual objects are memory-heavy, but it won’t show the full impact if the object holds references to other memory-heavy objects.
Retained Size
The retained size of an object is the total memory that would be released if the object and all its directly or indirectly referenced objects were deleted by the garbage collector.
In other words, retained size includes the shallow size of the object itself, plus the shallow sizes of all other objects that it keeps alive through references.
Retained size is particularly useful for spotting memory leaks. When an object has a large retained size, it’s often because it’s holding onto many other objects in memory, intentionally or unintentionally.
For instance, if Object A references Object B, then:
- Retained size of A: Includes the shallow size of A plus the shallow size of B (and any objects B references), because A keeps B "alive."
This metric reveals the memory impact of an object’s references. In debugging, it’s invaluable for detecting objects that are keeping large portions of memory occupied due to excessive or unexpected references.
Example
Let’s look at an example to make this clear:
- Object A has a shallow size of 50 KB.
- Object A references Object B, which has a shallow size of 30 KB.
- Object B references Object C, which has a shallow size of 20 KB.
Now, let's break down their sizes:
- Shallow Size of A: 50 KB (only the memory used by A itself).
- Retained Size of A: 100 KB (50 KB for A + 30 KB for B + 20 KB for C).
So, if Object A were deleted, the total memory that would be freed is 100 KB, since it keeps B and C alive as well.
Summary
Understanding the difference between shallow size and retained size can help us pinpoint which objects are responsible for holding onto large chunks of memory. This insight often reveals optimization opportunities or potential memory leaks.
To recap:
- Shallow Size: The memory directly occupied by an object. This shows how much space an individual object takes up.
- Retained Size: The total memory that would be freed if the object were deleted, including the memory used by all the objects it references. This can help identify memory leaks and the real impact on memory if the object were removed.
That's it—happy debugging! 🙏🙇♂️